


Our performance
From repairs to customer satisfaction, the work we do with our partners and the impact that we have on our communities. Find out how we are doing.
Take a look at our performance in more detail:
The Trust in 2025-2026 – P&PHT Annual Review
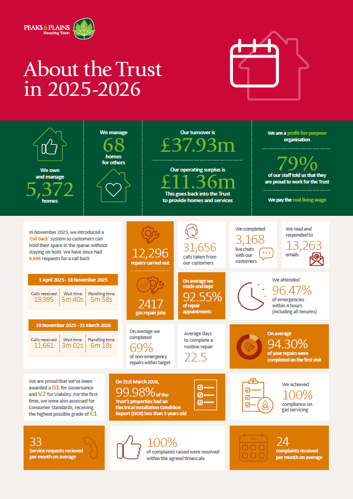
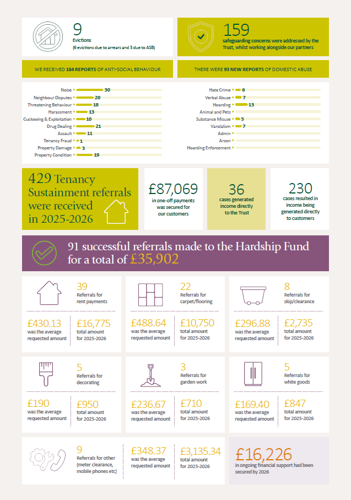
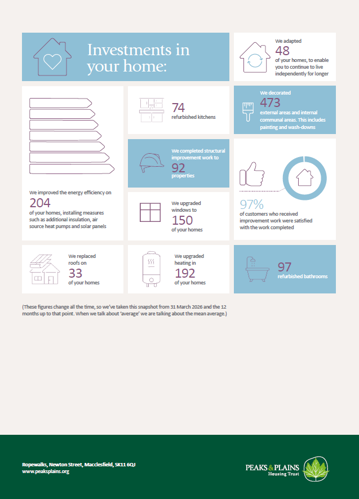
Our quarterly performance - checked by customers
Our Customer Challenge Group work with us to create a series of performance measures to hold us to account.
Every three months, we share the Trust's performance with our Customer Challenge Group to review and they support the sharing of the below results.
Our recent performance
Find all plain text from the video below.
Our Performance, April-June 2026: Checked and approved by Challenge Group, our Customer Panel.
Number of tenants who are actively involved:
To demonstrate the number of tenant's who are actively involved
|
2026 |
Where we are at |
Target |
|
April |
|
N/A |
|
May |
119 |
N/A |
|
June |
127 |
N/A |
- This quarter saw the kickstart of our Spring Scrutiny on ‘Reasonable Adjustments’, seeing new customers join the Panel.
- We also sent the ‘What matters most to you’ campaign in May to our Commentator Panel - asking for feedback on customer priorities.
- This quarter also saw the return of our customer panels like GMRG.
% Complaints responded to within timescales (YTD):
To understand what percentage of complaints that are being dealt with within agreed timescales for all stages of the policy:
|
2026 |
Where we are at |
Target |
|
April |
100% |
100% |
|
May |
100% |
100% |
|
June |
100% |
100% |
- From April 2026, we have responded to 124 complaints within timescale.
- 97 were ‘Stage One’ complaints.
- 27 were ‘Stage Two’ complaints.
% of first time resolution:
To understand what percentage of calls are dealt with by the Contact Centre Right First Time (RFT) without the need for a call back.
|
2026 |
Where we are at |
Target |
|
April |
94.81% |
92% |
|
May |
95.05% |
92% |
|
June |
95.07% |
92% |
During April-June 2026, our Neighbourhoods, Repairs & Income teams had the highest contact requests.
- A contact request is where we ask a member of the relevant team to call you back about your query.
% of service requests completed on time:
To monitor how many service requests completed each month were closed within 3 days.
|
2026 |
Where we are at |
Target |
|
January |
72.73% |
100% |
|
February |
82.93% |
100% |
|
March |
100% |
100% |
- There were 58 service requests in March and all were completed within timescale.
Number of compliments received:
To provide details of the number of customer compliments received and monitor any variances.
|
2026 |
Where we are at |
Target |
|
April |
16 |
No target |
|
May |
20 |
No target |
|
June |
6 |
No target |
- We received 42 compliments across the period.
- Compliments were given for quality of service, conduct & attitude.
% of first time fix – Repairs:
|
2026 |
Where we are at |
Target |
|
April |
96.09% |
92% |
|
May |
96.11% |
92% |
|
June |
96.86% |
92% |
- We have continued to deliver above average for first time fix repairs - with a total of 13,341 completed on the first visit.
% of emergencies attended within 4 hours:
To ensure emergency repairs are being delivered in a timely manner and meeting Trust targets.
|
2026 |
Where we are at |
Target |
|
April |
94.91% |
98% |
|
May |
94.29% |
98% |
|
June |
94.14% |
98% |
- The Trust is committed to attending all emergency appointments within 4 hours.
Number of properties below Decent Homes Standard:
Compliance with Home Standard.
|
2026 |
Where we are at |
Target |
|
April |
24 |
No target |
|
May |
29 |
No target |
|
June |
9 |
No target |
- As at the end of June there were 9 properties which do not meet the Decent Homes Standard. Two properties have now had work completed, five have work in progress and one is subject to a possession procedures
% of compliance indicators met:
To provide high level indication of compliance across all areas.
|
2026 |
Where we are at |
Target |
|
April |
84% |
100% |
|
May |
84% |
100% |
|
June |
84.61% |
100% |
- As at the end of June, of the 52 areas of compliance that are tracked, 8 were at less than 100% compliant.
% of fire compliance indicators met
To provide high level indication of compliance across all areas.
|
2026 |
Where we are at |
Target |
|
April |
100% |
100% |
|
May |
92.95% |
100% |
|
June |
100% |
100% |
Glossary:
ASB - Anti-Social Behaviour
YTD - Year To Date
TSMs - Tenant Satisfaction Measures
GM - Grounds Maintenance
Have a question?
If you have any questions or comments, or want to see our performance in another area, get in touch.
You can contact us by emailing getinvolved@peaksplains.org.